This was the final project of the course Introductionn to Information Retrieval and Text Mining.
For this project, our goal is to predict the sentiment of Tweets, and maximize the accuracy to determine the correct sentiment.
Advisor: Prof. Chien-Chin Chen @NTUIM
Co-workers: Kai-Hsiang Huang, Sze-Chi Wang, Chin-Hua Chang, Tsung-You Hou @NTUIM
Due to authority and IP policies, only few slides and contents are shown below.
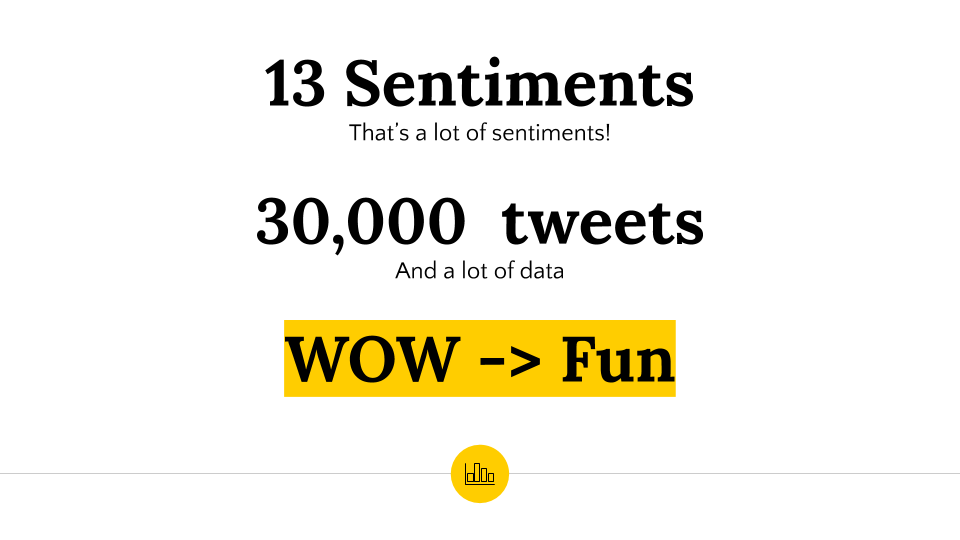
Data Description
Data Source: Twitter’s Sentiment Analysis based on Kaggle’s contest.
The sentiments are divided to 13 groups, incluidng happy, sad, netural …
In the dataset, there are over 30000 tweets.
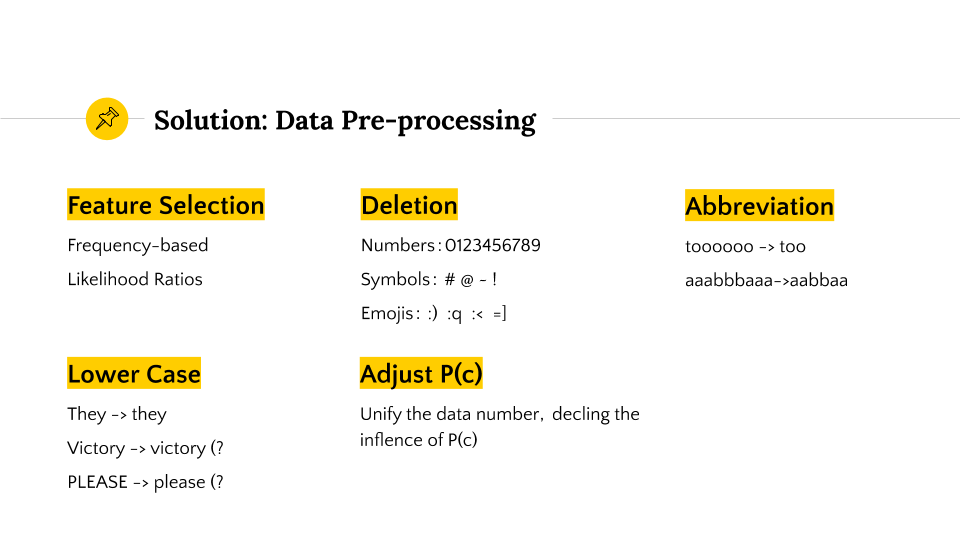
Data Preprocessing
Since the tweets are usually colloquial and short, it is necessary to do preprocessing with NLP techniques. We set up different criteria to implement the preprocessing, including:
- stopwords (customized and nltk)
- deletion (df, tf-idf)
- symbols
- lower cases
Also, one of the algorithm we are using was called Naive Bayes Algorithm.
Since the original distribution of classes (sentiments) is exteremly biased, the prior probability (P(c),frequency of class) would become extremely different, and this influence the model.
As a result, we unified the P(c) to reduce the effect of prior probability.
Toolkits used:
- nltk
- Stemmer (Porter)
The raw data is quite sparse and biased, and thus we spent lots of time to conduct data preprocessing.
Algorithms
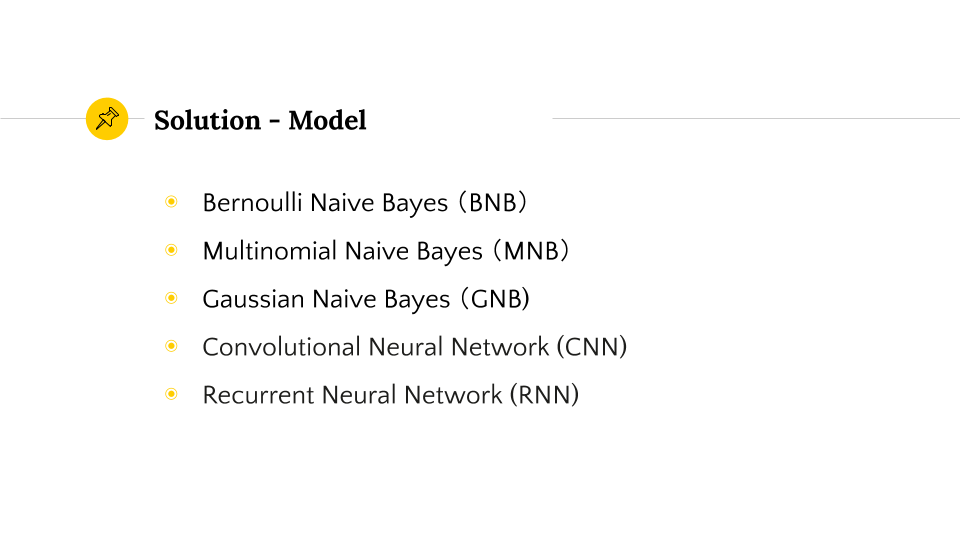
We implemented five different algorithms:
- Bernouli Naive Bayes (BNB)
- Multinominal Naive Bayes (MNB)
- Gaussian Naive Bayes (GNB)
- Convolutional Neural Network (CNN)
- Recurrent Neural Network (RNN)
Result
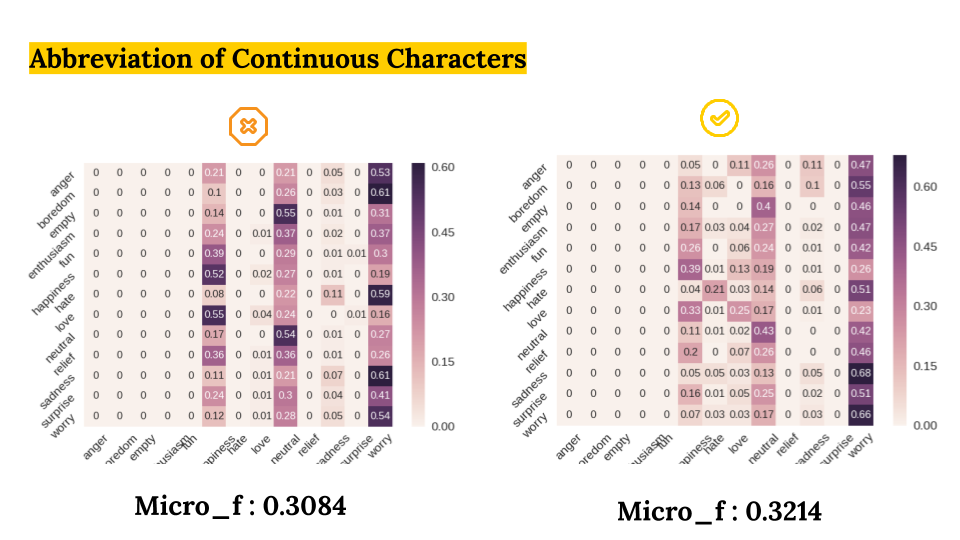
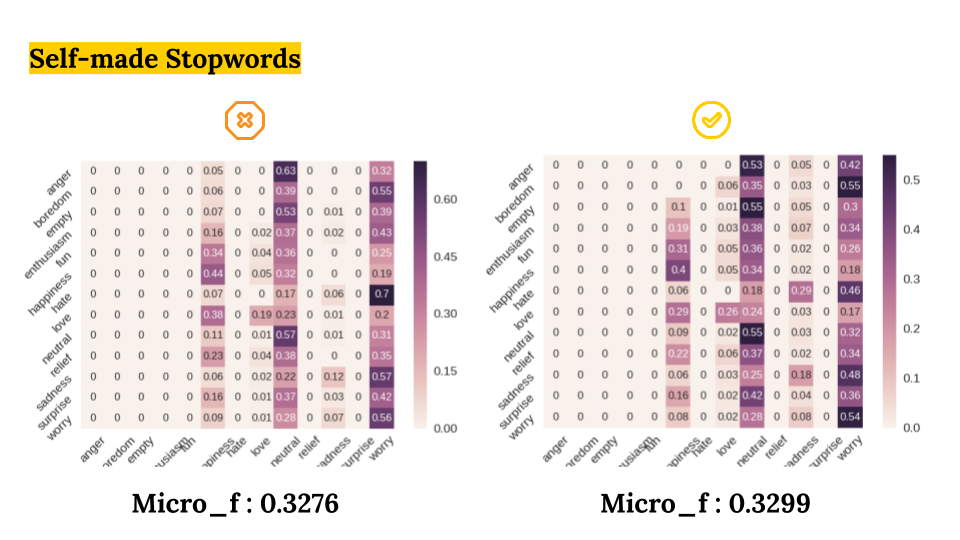
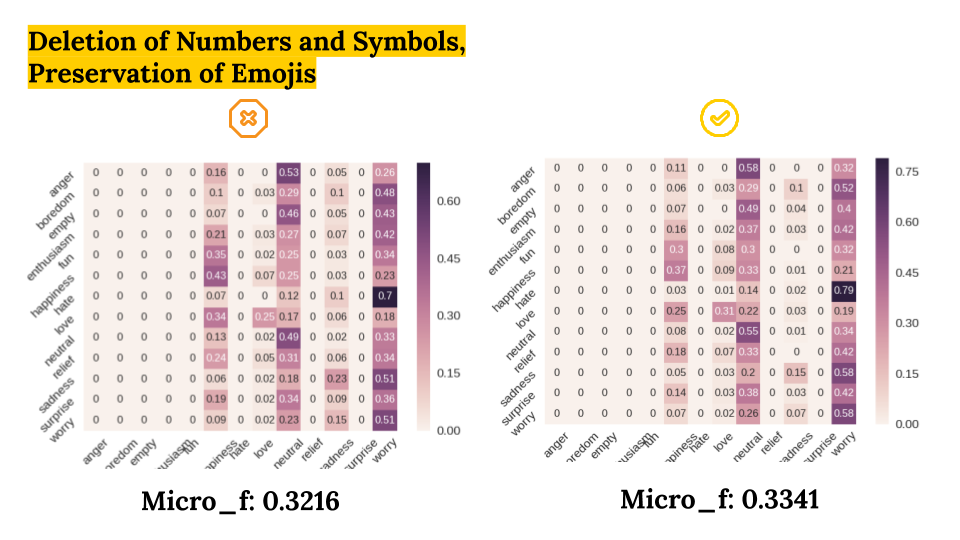
We compared six diffrent preprocessing methods with five models.
- Abbreviation of Continuous Characters (No vs Yes)
- nltk Stopwords vs Custiomized Stopwords
- Deletion of Numbers and Symbols, Preservation of Emojis (No vs Yes)
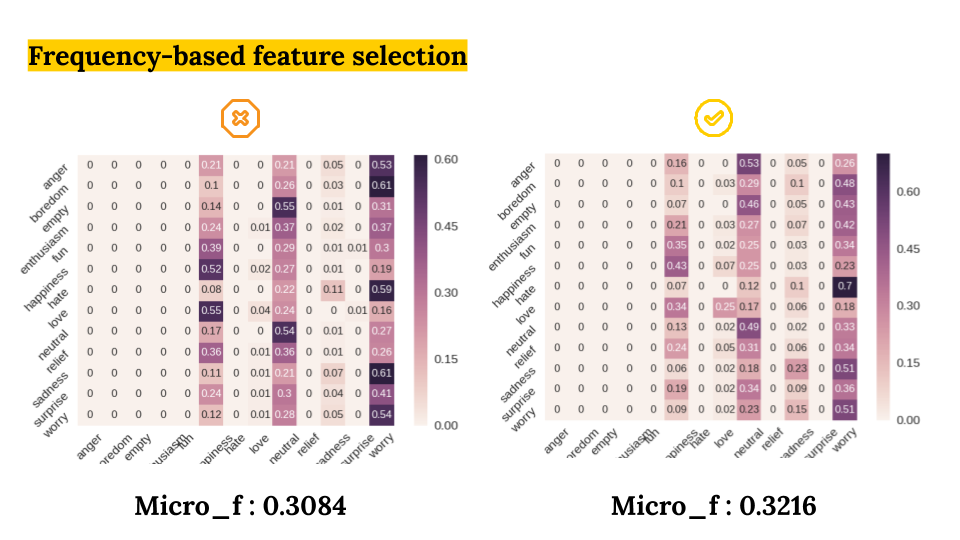
- Frequency based Feature Selection (No vs Yes)
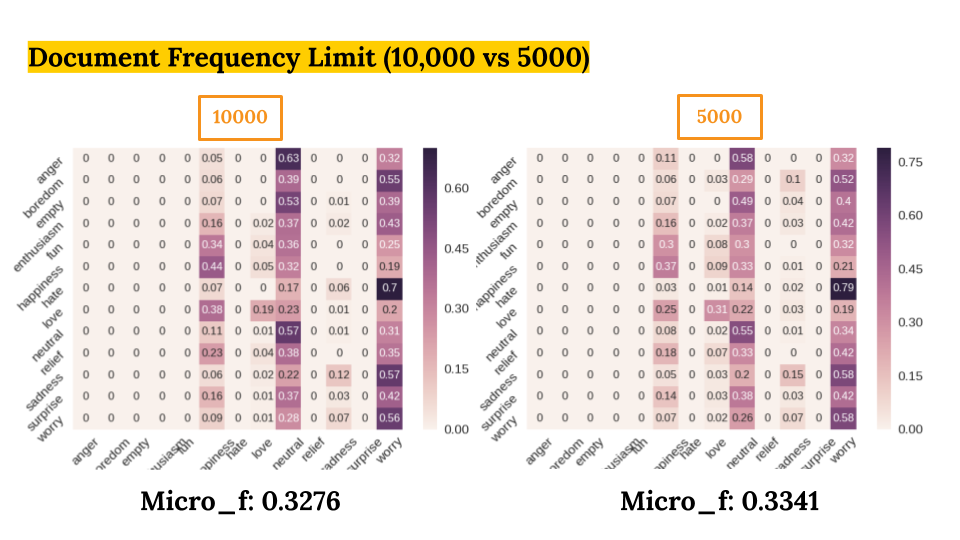
- Document Frequency Limit (5000 vs 10000)
As a result, we got the best Micro-F1 Score of 0.33 with:
- Algorithm: RNN
- Data preprocessing method: Deletion of Numbers and Symbols, Preservation of Emojis.
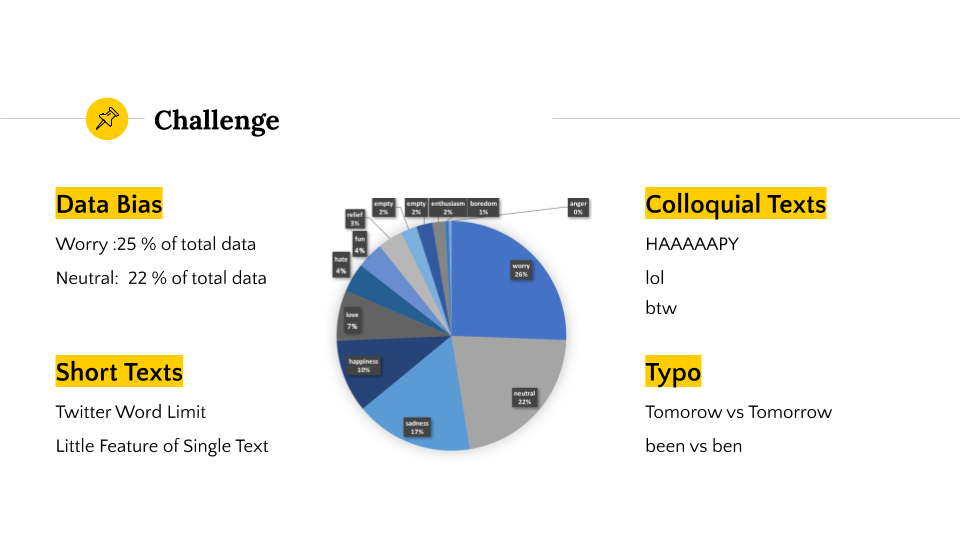
Challenges
There are four major challenges we encountered:
- Data bias: Worry constituted 25% of data, and Neutral constituted 25% of data.
- Colloquial Texts: eg. HAAAAAPY, lol, btw, tbh
- Short Texts: Twitter word limit -> sparse feature vector
- Typo: eg. been vs ben, tomorow vs tomorrow
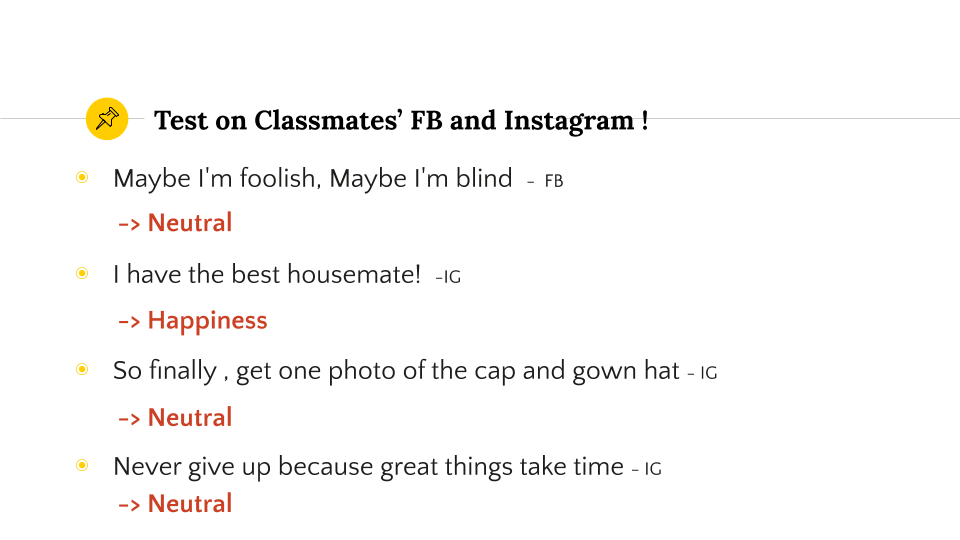
Real-time testing
Actually, we did a live test on classmates’ posts on Facebook and Instagram :)
Somehow, the predicter did a good job on predicting happiness!
As for the neutral ones, the classmates had indicated that they had no negative moods while posting them.
So… We guess that somehow the predictor did a good job :)